Basic Repetition
You can subdivide the same data down by calling substitution multiple times.
tiles <- return_rhombus(0, 0, -90 + 36, 100, 'T') %>%
  substitution() %>%
  substitution() %>%
  substitution() %>%
  substitution() %>%
  substitution() %>%
  pivot_down()

ggplot(tiles) +
  geom_polygon(aes(x = x,
                   y = y,
                   fill = shape,
                   group = triangle)) +
  coord_equal()
You can also use a loop.
tiles <- return_rhombus(0, 0, -90 + 36, 100, 'T')

for(i in seq(1, 5)) {
  tiles <- tiles %>% substitution()
}

tiles <- tiles %>%
  pivot_down()

ggplot(tiles) +
  geom_polygon(aes(x = x,
                   y = y,
                   fill = shape,
                   group = triangle)) +
  coord_equal()
Using purrr::reduce will wrap everything up nicely into a function call. You’ll need to pass a function with two parameters for it to work.
tiles <- return_rhombus(0, 0, -90 + 36, 100, 'T')

tiles <- purrr::reduce(.x = rep(list(1), 5),
                       .f = function(df, x) {substitution(df)},
                       .init = tiles)

tiles <- tiles %>%
  pivot_down()

ggplot(tiles) +
  geom_polygon(aes(x = x,
                   y = y,
                   fill = shape,
                   group = triangle)) +
  coord_equal()
Advance Repetition
This setup can pass a function that subdivides different sections of the data set. For example, the mean x position of a triangle can determine the number of times to subdivide it.
tiles <- return_rhombus(0, 0, -90 + 36, 100, 'T') %>%
  substitution() %>%
  substitution() %>%
  pivot_down() %>%
  group_by(triangle) %>%
  mutate(mean_x = mean(x))

ggplot(tiles) +
  geom_polygon(aes(x = x,
                   y = y,
                   fill = mean_x,
                   group = triangle)) +
  coord_equal()
By creating a function that checks if the mean x position is right of a cutoff and passing the cutoffs as a list, purrr::reduce will loop through the cutoffs and apply the function appropriately. In this example, triangles with a mean x position to the right of 10, 20, …, 80 will be subdivided.
check_substitution <- function(df, x) {
  df <- df %>%
    rowwise() %>%
    mutate(mean_x = c(point1_x + point2_x + point3_x) / 3) %>%
    mutate(subdivide = if_else(mean_x > x, TRUE, FALSE))

  df_subdivide <- df %>%
    filter(subdivide == TRUE) %>%
    select(-subdivide) %>%
    substitution()

  df <- df %>%
    filter(subdivide == FALSE) %>%
    select(-subdivide) %>%
    bind_rows(df_subdivide) %>%
    select(-c(triangle, rhombus)) %>% # reset triangle and rhombus
    rowid_to_column("triangle") %>%
    group_by(point1_x, point1_y, point3_x, point3_y) %>%
    mutate(rhombus = cur_group_id()) %>%
    ungroup()

  return(df)
}

tiles <- return_rhombus(0, 0, -90 + 36, 100, 'T')

tiles <- purrr::reduce(.x = as.list(seq(10, 80, by = 10)),
                .f = check_substitution,
                .init = tiles)

tiles <- tiles %>%
  pivot_down()

ggplot(tiles) +
  geom_polygon(aes(x = x,
                   y = y,
                   fill = shape,
                   group = triangle)) +
  coord_equal()
In the following example, the distance to (0, 0) determines the cutoffs. This example also uses the center of the rhombus instead of the triangle.
tiles <- return_starting_circle(0, 0, 90, 5, 'T') %>%
  substitution() %>%
  pivot_down() %>%
  select(-triangle) %>%
  distinct() %>%
  group_by(rhombus) %>%
  mutate(center_x = mean(x),
         center_y = mean(y)) %>%
  mutate(distance = round(sqrt(center_x^2 + center_y^2), 2))

ggplot(tiles) +
  geom_polygon(aes(x = x,
                   y = y,
                   fill = as.character(distance),
                   group = rhombus)) +
  coord_equal() +
  scale_fill_discrete("Distance from center") +
  theme(legend.position = "bottom")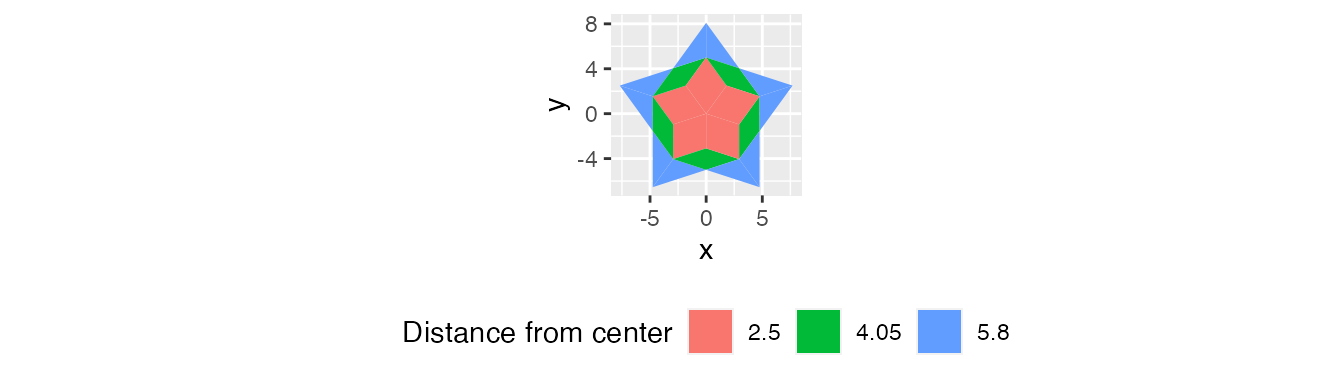
We’ll use cutoffs of 3 and 5. These will subdivide the middle and outside once, then the outside another time. So now we need to stick this in a function, subdivide the ones that pass, and join back to the triangles that didn’t.
check_substitution <- function(df, x) {
  df <- df %>%
    mutate(mean_x = c(point1_x + point2_x + point3_x) / 3,
           mean_y = c(point1_y + point2_y + point3_y) / 3) %>%
    group_by(rhombus) %>%
    mutate(mean_x = mean(mean_x),
           mean_y = mean(mean_y)) %>%
    ungroup() %>%
    mutate(distance = sqrt(mean_x^2 + mean_y^2)) %>%
    mutate(subdivide = if_else(distance > x, TRUE, FALSE))

  df_subdivide <- df %>%
    filter(subdivide == TRUE) %>%
    select(-subdivide) %>%
    substitution() %>%
    substitution()

  df <- df %>%
    filter(subdivide == FALSE) %>%
    select(-subdivide) %>%
    bind_rows(df_subdivide) %>%
    select(-c(triangle, rhombus)) %>% # reset triangle and rhombus
    rowid_to_column("triangle") %>%
    group_by(point1_x, point1_y, point3_x, point3_y) %>%
    mutate(rhombus = cur_group_id()) %>%
    ungroup()

  return(df)
}

tiles <- return_starting_circle(0, 0, 90, 5, 'T') %>%
  substitution()

tiles <- purrr::reduce(.x = as.list(c(3, 5)),
                       .f = check_substitution,
                       .init = tiles)

tiles <- tiles %>%
  pivot_down() %>%
  select(-triangle) %>%
  distinct() %>%
  group_by(rhombus) %>%
  mutate(center_x = mean(x),
         center_y = mean(y)) %>%
  mutate(distance = round(sqrt(center_x^2 + center_y^2), 2))

ggplot(tiles) +
  geom_polygon(aes(x = x,
                   y = y,
                   fill = distance,
                   group = rhombus)) +
  coord_equal()
A small catch here is that the rhombus centers change after subdivision. So if you want the distances from the starting set, keep the centers from the beginning and don’t recalculate.
check_substitution <- function(df, x) {
  df <- df %>%
    mutate(subdivide = if_else(distance > x, TRUE, FALSE))

  df_subdivide <- df %>%
    filter(subdivide == TRUE) %>%
    select(-subdivide) %>%
    substitution() %>%
    substitution()

  df <- df %>%
    filter(subdivide == FALSE) %>%
    select(-subdivide) %>%
    bind_rows(df_subdivide) %>%
    select(-c(triangle, rhombus)) %>% # reset triangle and rhombus
    rowid_to_column("triangle") %>%
    group_by(point1_x, point1_y, point3_x, point3_y) %>%
    mutate(rhombus = cur_group_id()) %>%
    ungroup()

  return(df)
}

tiles <- return_starting_circle(0, 0, 90, 5, 'T') %>%
  substitution() %>%
  mutate(mean_x = c(point1_x + point2_x + point3_x) / 3,
         mean_y = c(point1_y + point2_y + point3_y) / 3) %>%
  group_by(rhombus) %>%
  mutate(mean_x = mean(mean_x),
         mean_y = mean(mean_y)) %>%
  ungroup() %>%
  mutate(distance = sqrt(mean_x^2 + mean_y^2))

tiles <- purrr::reduce(.x = as.list(c(3, 5)),
                       .f = check_substitution,
                       .init = tiles)

tiles <- tiles %>%
  pivot_down() %>%
  select(-triangle) %>%
  distinct() %>%
  group_by(rhombus) %>%
  mutate(center_x = mean(x),
         center_y = mean(y)) %>%
  mutate(distance = round(sqrt(center_x^2 + center_y^2), 2))

ggplot(tiles) +
  geom_polygon(aes(x = x,
                   y = y,
                   fill = distance,
                   group = rhombus)) +
  coord_equal()
There are slight differences between this image and the previous one.